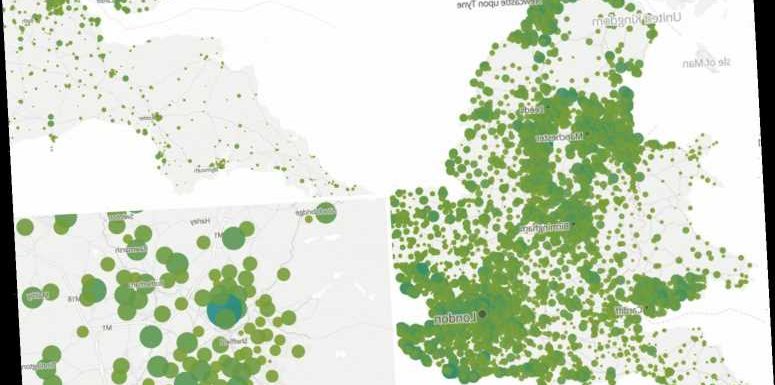
THIS interactive map reveals the number of people who have died from coronavirus in your local area by postcode.
It uses the latest official data where Covid-19 was listed as the cause of death in England and Wales since the outbreak of the pandemic.
? Read our coronavirus live blog for the latest news & updates…
The figures from the Office for National Statistics reveal that just a handful of places have been untouched by a Covid fatality since March 2020.
Of the 7,209 districts, just 36 – or 0.5 per cent – had not recorded a single Covid-linked death by the end of January this year.
The ONS data uses what are known as middle super output areas (MSOAs) – which they say are similar to postcodes though some have been combined.
The area to suffer the most deaths since the pandemic began was Crabtree and Fir Vale in Sheffield with 72 fatalities, figures show.
This was followed by West St Leonards in Hastings, where there have been 62 Covid-related deaths.
It's thought in both these areas the high death rate is linked to care homes, after the virus ripped through the most vulnerable during the first wave.
The third worst-hit area was Hadleigh in Suffolk where 57 people have died.
There are also five care homes in the small market town as well as a high school where there was an outbreak in November.
Meanwhile some areas of the South West have recorded no Covid-linked deaths so far.
These include nine places in Devon, five in Cornwall and three in Bristol.
Last month was also the second deadliest month on record with 68,796 fatalities from all causes in England.
The deadliest month was still April 2020 when the country was at the peak of the first Covid wave and 88,153 people in England died.
Coronavirus was the leading cause of death in January for the third month in a row.
It accounted for 37.4 per cent of all deaths registered – more than four time the number for the second-leading cause of deaths – dementia in England and heart disease in Wales.
Dementia and Alzheimer's disease was the most common pre-existing condition among Covid-19 deaths in England and Wales last year, identified in 25.3 per cent of deaths due to the virus.
The figures also show how the virus has had a disproportionate impact on people living in cities and deprived areas compared to rural communities.
A previous ONS report has found that people in the most deprived areas of England and Wales are around twice as likely to die after contracting Covid.
Experts believe that a range of factors, including overcrowding, income, employment, disability and health status, could be to blame.
London suffered the highest mortality rate from Covid in January with 900.6 deaths per 100,000 people, followed by East of England at 700.2 deaths per 100,000.
These regions were both badly hit by outbreaks of the Kent variant at the end of last year, prompting ministers to shelve Christmas bubbles.
The South West had the lowest Covid-19 mortality rate, at 295.6 deaths per 100,000 people.
In England, the mortality rate for deaths due to Covid-19 in January in the most deprived areas was 710.4 deaths per 100,000 people.
This was 1.8 times the mortality rate in the least deprived areas (400.1 deaths per 100,000 people).
It comes as Government figures today showed a further 254 people who tested positive for coronavirus have died in hospital in England.
This brought the total number of confirmed deaths reported in hospitals to 82,410, NHS England said on Thursday.
Patients were aged between 26 and 99. All except 13, aged between 57 and 94, had known underlying health conditions.
The deaths were between December 28 and February 24.
There were 51 other deaths reported with no positive Covid-19 test result.
Source: Read Full Article


